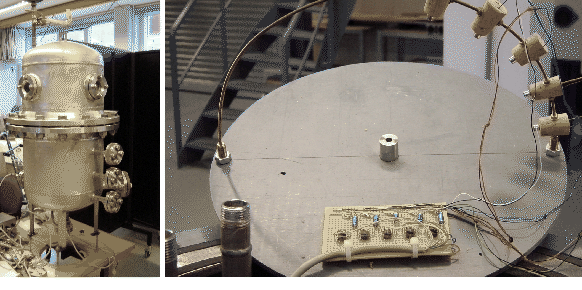
In our group there is sufficient knowledge to perform the flow measurements as described above, see for instance figure 5. Up to now we have had no experience with sound measurements. Therefore, to show the feasibility of the proposed experiment in our laboratory we have performed some very preliminary acoustic measurements.
In an existing
pressure vessel with dimensions similar to the one shown in figure 4 we
have placed five small inexpensive microphones with a diameter of
 m (see figure 6). The microphones are connected to
amplifiers. The five microphones are placed under different angles
m (see figure 6). The microphones are connected to
amplifiers. The five microphones are placed under different angles  . A small vacuum pump has been used to reduce the pressure in the
vessel to
. A small vacuum pump has been used to reduce the pressure in the
vessel to  bar. A valve is opened to let air into the vessel
through a pipe with a diameter of
bar. A valve is opened to let air into the vessel
through a pipe with a diameter of  mm. This generates a jet with an
initial diameter of mm and with a fairly low Reynolds number. The
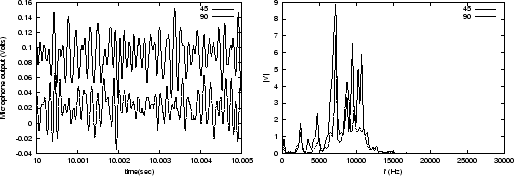
output of two of the microphones as a function of time is plotted in figure
7(left). (Due to limitations of the measurement hardware we were
only able to record two channels with the desired speed of 100 kHz). The
corresponding power spectra are shown in figure 7(right).
These preliminary measurements show that of the
shelf microphones can be used to measure acoustic fields at rather
low pressures.
mm. This generates a jet with an
initial diameter of mm and with a fairly low Reynolds number. The
output of two of the microphones as a function of time is plotted in figure
7(left). (Due to limitations of the measurement hardware we were
only able to record two channels with the desired speed of 100 kHz). The
corresponding power spectra are shown in figure 7(right).
These preliminary measurements show that of the
shelf microphones can be used to measure acoustic fields at rather
low pressures.
The presence of this pressure vessel does not rule out the necessity to build a new experimental setup because this existing pressure vessel is not suited for the flow measurements that we have described above.
 |